North Korea (Democratic People’s Republic of Korea), KP
North Korea: Independent country in East Asia
About

Quick Facts about Democratic People’s Republic of Korea
| Population : | 25,490,965 |
| Country : | North Korea |
| Head of government : | Premier of North Korea |
| Area : | 120540 km2 |
| Official name : | la République populaire démocratique de Corée, 조선민주주의인민공화국 |
| Continent : | Asia |
| Easternmost point : | Point(130.69751278 42.29053051) |
| Northernmost point : | Point(129.93 43.0) |
| Legislative body : | Supreme People's Assembly |
| Official language : | North Korean standard language |
| Capital : | Pyongyang |
| Establishment : | September 09, 1948 (76 years ago) |
| Time Zone : | UTC+09:00, UTC+08:30, UTC+08:30 |
| Local time : | 4/23/2025 - 5:15:24 PM |


Geography
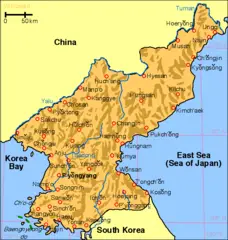
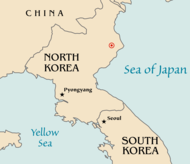
Democratic People’s Republic of Korea is located at 40°0'0"N 127°0'0"E (40.0000000, 127.0000000). It has 3 neighbors: China, South Korea and Russia.
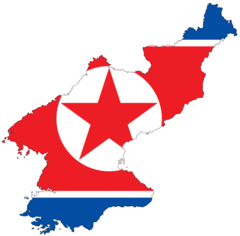
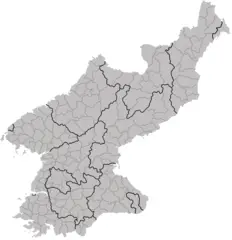
North Korea map
The largest city of Democratic People’s Republic of Korea is Pyongyang with a population of 2,863,000. Other cities include, Hamhŭng population 559,056, Sinŭiju population 359,341, Chongjin population 327,000 and Sariwŏn population 310,100. See all Democratic People’s Republic of Korea cities & populated places.
- Official Website
Official website of Democratic People’s Republic of Korea
- Kim Jae-ryong , 2019-04-11T00:00:00Z
- Pak Pong-ju , 11 April, 2019 2013-04-01T00:00:00Z
- Choe Yong-rim , 1 April, 2013 2010-06-07T00:00:00Z
- Kim Yong-il , 7 June, 2010 2007-04-11T00:00:00Z
- Pak Pong-ju , 11 April, 2007 2003-09-03T00:00:00Z
Democratic People’s Republic of Korea has 3 neighbours.
- People’s Republic of China Independent country in East Asia
- Republic of Korea Independent country in East Asia
- Russian Federation Independent country in Eastern Europe and Northern Asia
- Ryanggang Province
- Rason
- North Hwanghae Province
- Pyongyang
- Nampho
- North Pyongan Province
- South Hamgyong Province
- South Hwanghae Province
- South Pyongan Province
- North Hamgyong Province
- Chagang Province
- Kangwon Province
Demographics
| Year | Population | % Change | Method |
| 1960 | 11,424,179 | - | census |
| 1961 | 11,665,593 | 2.07% | census |
| 1962 | 11,871,721 | 1.74% | census |
| 1963 | 12,065,471 | 1.61% | census |
| 1964 | 12,282,423 | 1.77% | census |
| 1965 | 12,547,526 | 2.11% | census |
| 1966 | 12,864,685 | 2.47% | census |
| 1967 | 13,221,828 | 2.7% | estimation process |
| 1968 | 13,608,614 | 2.84% | census |
| 1969 | 14,009,171 | 2.86% | estimation process |
| 1970 | 14,410,403 | 2.78% | estimation process |
| 1971 | 14,812,366 | 2.71% | census |
| 1972 | 15,214,618 | 2.64% | census |
| 1973 | 15,603,005 | 2.49% | census |
| 1974 | 15,960,131 | 2.24% | estimation process |
| 1975 | 16,274,744 | 1.93% | census |
| 1976 | 16,539,033 | 1.6% | census |
| 1977 | 16,758,831 | 1.31% | census |
| 1978 | 16,953,627 | 1.15% | census |
| 1979 | 17,151,326 | 1.15% | census |
| 1980 | 17,372,172 | 1.27% | census |
| 1981 | 17,623,339 | 1.43% | census |
| 1982 | 17,899,241 | 1.54% | census |
| 1983 | 18,191,886 | 1.61% | census |
| 1984 | 18,488,002 | 1.6% | census |
| 1985 | 18,778,106 | 1.54% | census |
| 1986 | 19,058,994 | 1.47% | census |
| 1987 | 19,334,557 | 1.43% | census |
| 1988 | 19,610,518 | 1.41% | census |
| 1989 | 19,895,397 | 1.43% | census |
| 1990 | 20,194,361 | 1.48% | census |
| 1991 | 20,510,215 | 1.54% | census |
| 1992 | 20,838,090 | 1.57% | estimation process |
| 1993 | 21,166,238 | 1.55% | census |
| 1994 | 21,478,552 | 1.45% | census |
| 1995 | 21,763,678 | 1.31% | estimation process |
| 1996 | 22,016,518 | 1.15% | census |
| 1997 | 22,240,833 | 1.01% | estimation process |
| 1998 | 22,444,993 | 0.91% | estimation process |
| 1999 | 22,641,754 | 0.87% | census |
| 2000 | 22,840,225 | 0.87% | estimation process |
| 2001 | 23,043,449 | 0.88% | census |
| 2002 | 23,248,059 | 0.88% | census |
| 2003 | 23,449,180 | 0.86% | estimation process |
| 2004 | 23,639,303 | 0.8% | census |
| 2005 | 23,813,333 | 0.73% | census |
| 2006 | 23,969,917 | 0.65% | census |
| 2007 | 24,111,989 | 0.59% | census |
| 2008 | 24,243,894 | 0.54% | census |
| 2009 | 24,371,865 | 0.53% | census |
| 2010 | 24,500,520 | 0.53% | estimation process |
| 2011 | 24,052,231 | -1.86% | census |
| 2012 | 24,763,188 | 2.87% | census |
| 2013 | 24,895,480 | 0.53% | census |
| 2014 | 50,746,659 | 50.94% | (Worldbank) |
| 2015 | 51,014,947 | 0.53% | (Worldbank) |
| 2016 | 51,217,803 | 0.4% | (Worldbank) |
| 2017 | 25,490,965 | -100.93% | census |
| 2018 | 51,606,633 | 50.61% | (Worldbank) |
| 2019 | 51,709,098 | 0.2% | (Worldbank) |
_chagang_clear.png)
_chagang.png)
_clear.png)
_kaesong_clear.png)
_kangwon_clear.png)
_kumgansan_clear.png)
_n_hamgyong_clear.png)
_n_hwanghae_clear.png)
_n_pyongan_clear.png)
_pyongang_clear.png)
_rason_clear.png)
_ryangang_clear.png)
_s_hamgyong_clear.png)
_s_hwanghae_clear.png)
_s_pyongan_clear.png)
_sinuiju_clear.png)
