Congo Kinshasa (Democratic Republic of the Congo), CD
Congo Kinshasa: Independent country in Central Africa
About

Quick Facts about Democratic Republic of the Congo
| Population : | 91,931,000 |
| Country : | Democratic Republic of the Congo |
| Different from : | Republic of the Congo |
| Head of government : | Prime Minister of the Democratic Republic of the Congo |
| Plate code : | CGO |
| Area : | 2344858 km2 |
| Official name : | la République démocratique du Congo, République démocratique du Congo, République Démocratique du Congo |
| Water as percent of area : | 3.3% |
| Land as percent of area : | 96.7% |
| Continent : | Africa |
| Annual number of weddings : | 8247, 17671, 38127, 10912, 13466, 35107, 22367, 8448, 10261, 15175, 8065, 8892, 8195 |
| Easternmost point : | Point(31.313 2.127) |
| Northernmost point : | Point(25.53 5.4) |
| Legislative body : | Parliament of the Democratic Republic of the Congo |
| Named for : | Congo |
| Official language : | French |
| Capital : | Kinshasa |
| Establishment : | June 06, 1960 (64 years ago) |
| Time Zone : | UTC+01:00, UTC+02:00 |
| Local time : | 09:44:38 (25th April 2025) |


Geography
Democratic Republic of the Congo is located at 0°0'0"N 25°0'0"E (0.0, 25.0). It has 11 neighbors: Rwanda, Tanzania, Uganda, Central African Republic, Sudan, Burundi, Zambia, Cameroon, Congo Brazzaville, Angola and South Sudan.
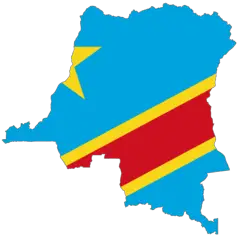
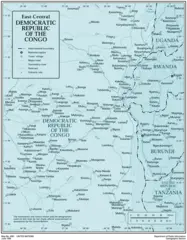
Congo Kinshasa map
The largest city of Democratic Republic of the Congo is Kinshasa with a population of 11,855,000. Other cities include, Mbuji-Mayi population 874,761, Kananga population 463,546, Likasi population 422,414 and Kolwezi population 418,000. See all Democratic Republic of the Congo cities & populated places.
- Bruno Tshibala , 7 September, 2019 2017-04-07T00:00:00Z
- Sylvestre Ilunga , 2019-09-07T00:00:00Z
Democratic Republic of the Congo has 11 neighbours.
- Republic of Rwanda Independent country in Africa
- United Republic of Tanzania Independent country in Africa
- Republic of Uganda Independent country in East Africa
- Central African Republic Independent country in Africa
- Republic of the Sudan Independent country in Northeast Africa
- Republic of Burundi Independent country in Africa
- Republic of Zambia Independent country in Southern Africa
- Republic of Cameroon Independent country in West Africa
- Republic of the Congo Independent country in Central Africa
- Republic of Angola Independent country in Africa
- South Sudan Independent country in Africa
- Bandundu Province
- Kongo Central
- Kasaï-Occidental
- Kasaï-Oriental
- North Kivu
- Orientale Province
- Équateur Province
- Kinshasa
- Maniema
- South Kivu
- Katanga Province
Demographics
| Year | Population | % Change | Method |
| 1960 | 15,248,246 | - | project management estimation |
| 1961 | 15,637,715 | 2.49% | estimation process |
| 1962 | 16,041,247 | 2.52% | estimation process |
| 1963 | 16,461,914 | 2.56% | estimation process |
| 1964 | 16,903,899 | 2.61% | project management estimation |
| 1965 | 17,369,859 | 2.68% | project management estimation |
| 1966 | 17,861,860 | 2.75% | estimation process |
| 1967 | 18,378,189 | 2.81% | estimation process |
| 1968 | 18,913,177 | 2.83% | estimation process |
| 1969 | 19,458,874 | 2.8% | project management estimation |
| 1970 | 20,009,902 | 2.75% | project management estimation |
| 1971 | 20,563,258 | 2.69% | project management estimation |
| 1972 | 21,121,467 | 2.64% | estimation process |
| 1973 | 21,691,346 | 2.63% | project management estimation |
| 1974 | 22,282,713 | 2.65% | project management estimation |
| 1975 | 22,902,275 | 2.71% | project management estimation |
| 1976 | 23,554,958 | 2.77% | project management estimation |
| 1977 | 24,238,011 | 2.82% | project management estimation |
| 1978 | 24,941,431 | 2.82% | project management estimation |
| 1979 | 25,650,884 | 2.77% | project management estimation |
| 1980 | 26,357,407 | 2.68% | estimation process |
| 1981 | 27,060,353 | 2.6% | estimation process |
| 1982 | 27,767,775 | 2.55% | estimation process |
| 1983 | 28,490,510 | 2.54% | project management estimation |
| 1984 | 29,243,529 | 2.57% | estimation process |
| 1985 | 30,039,873 | 2.65% | project management estimation |
| 1986 | 30,871,855 | 2.69% | estimation process |
| 1987 | 31,740,965 | 2.74% | estimation process |
| 1988 | 32,679,158 | 2.87% | project management estimation |
| 1989 | 33,727,905 | 3.11% | project management estimation |
| 1990 | 34,910,591 | 3.39% | estimation process |
| 1991 | 36,253,025 | 3.7% | project management estimation |
| 1992 | 37,731,020 | 3.92% | project management estimation |
| 1993 | 39,257,294 | 3.89% | estimation process |
| 1994 | 40,711,816 | 3.57% | estimation process |
| 1995 | 42,012,524 | 3.1% | project management estimation |
| 1996 | 43,122,601 | 2.57% | project management estimation |
| 1997 | 44,078,397 | 2.17% | project management estimation |
| 1998 | 44,960,941 | 1.96% | project management estimation |
| 1999 | 45,889,100 | 2.02% | project management estimation |
| 2000 | 46,949,244 | 2.26% | estimation process |
| 2001 | 48,167,045 | 2.53% | project management estimation |
| 2002 | 49,516,960 | 2.73% | project management estimation |
| 2003 | 50,972,323 | 2.86% | project management estimation |
| 2004 | 52,487,293 | 2.89% | estimation process |
| 2005 | 54,028,003 | 2.85% | project management estimation |
| 2006 | 55,590,838 | 2.81% | project management estimation |
| 2007 | 57,187,942 | 2.79% | project management estimation |
| 2008 | 58,819,038 | 2.77% | project management estimation |
| 2009 | 60,486,276 | 2.76% | project management estimation |
| 2010 | 62,191,161 | 2.74% | project management estimation |
| 2011 | 63,931,512 | 2.72% | project management estimation |
| 2012 | 65,705,093 | 2.7% | project management estimation |
| 2013 | 67,513,677 | 2.68% | project management estimation |
| 2014 | 73,722,860 | 8.42% | project management estimation |
| 2015 | 76,196,619 | 3.25% | estimation process |
| 2016 | 78,736,153 | 3.23% | project management estimation |
| 2017 | 81,339,988 | 3.2% | estimation process |
| 2018 | 84,068,091 | 3.25% | (Worldbank) |
| 2019 | 91,931,000 | 8.55% | project management estimation |

