Swaziland (Eswatini), SZ
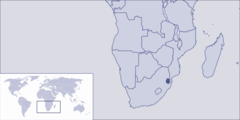
Swaziland: A landlocked country in Southern Africa, situated between Mozambique and South Africa.
About

Country Snapshot
Eswatini at a glance
Eswatini currently has 16 quality-checked populated place pages and 4 state or regional pages linked on MapSof.
Mapped cities & towns
16
These counts use a stricter populated-place filter so the main lists stay focused on real city and town pages.
States & regions
4
Open related pagesLargest city
ManziniPopulation 110,537
Top linked places
Quick Facts about Eswatini
| Population | 1,235,549 |
| Country | Eswatini |
| Different from | Wituland |
| Plate code | SD |
| Area | 17364 km2 |
| Official name | Eswatini, Königreich Eswatini, le Royaume du Swaziland, Eswatini (en), Umbuso weSwatini, Королевство Эсватини, Королевство Свазиленд, Kingdom of Eswatini |
| Continent | Africa |
| Easternmost point | Point(32.13488638 -26.52680065) |
| Northernmost point | Point(31.42 -25.72) |
| Latitude & Longitude | -26.5000,31.5000 |
| Legislative body | Parliament of Eswatini |
| Official language | Swazi, English |
| Capital | Mbabane, Lobamba |
| Establishment | September 06, 1968 (57 years ago) |
| Time Zone | South African Standard Time, UTC+02:00 |
| Local time | 01:09:04 (28th July 2026) |

Geography
Eswatini is located at 26°30'0"S 31°30'0"E (-26.5000000, 31.5000000). It has 2 neighbors: South Africa and Mozambique.
Swaziland map
The largest city of Eswatini is Manzini with a population of 110,537. Other cities include and Mbabane population 76,218. See all Eswatini cities & populated places.
Official website of Eswatini
Official WebsiteCompare Eswatini with
- Lubombo District
- Hhohho District
- Shiselweni District
- Manzini Region
Demographics
| Year | Population | % Change | Method |
|---|---|---|---|
| 1960 | 349,233 | - | 44163 |
| 1961 | 357,522 | 2.32% | 44163 |
| 1962 | 365,719 | 2.24% | 44163 |
| 1963 | 373,991 | 2.21% | 44163 |
| 1964 | 382,575 | 2.24% | 44163 |
| 1965 | 391,659 | 2.32% | 44163 |
| 1966 | 401,295 | 2.4% | 44163 |
| 1967 | 411,478 | 2.47% | 44163 |
| 1968 | 422,266 | 2.55% | 44163 |
| 1969 | 433,709 | 2.64% | 44163 |
| 1970 | 445,844 | 2.72% | 44163 |
| 1971 | 458,717 | 2.81% | 44163 |
| 1972 | 472,337 | 2.88% | 44163 |
| 1973 | 486,656 | 2.94% | 44163 |
| 1974 | 501,596 | 2.98% | 44163 |
| 1975 | 517,100 | 3% | 44163 |
| 1976 | 533,264 | 3.03% | 44163 |
| 1977 | 550,135 | 3.07% | 44163 |
| 1978 | 567,560 | 3.07% | 44163 |
| 1979 | 585,335 | 3.04% | 44163 |
| 1980 | 603,373 | 2.99% | 44163 |
| 1981 | 621,314 | 2.89% | 44163 |
| 1982 | 639,333 | 2.82% | 44163 |
| 1983 | 658,496 | 2.91% | 44163 |
| 1984 | 680,253 | 3.2% | 44163 |
| 1985 | 705,492 | 3.58% | 44163 |
| 1986 | 734,790 | 3.99% | 44163 |
| 1987 | 767,417 | 4.25% | 44163 |
| 1988 | 801,350 | 4.23% | 44163 |
| 1989 | 833,787 | 3.89% | 44163 |
| 1990 | 862,728 | 3.35% | 44163 |
| 1991 | 887,248 | 2.76% | 44163 |
| 1992 | 907,947 | 2.28% | 44163 |
| 1993 | 926,224 | 1.97% | 44163 |
| 1994 | 944,223 | 1.91% | 44163 |
| 1995 | 963,428 | 1.99% | 44163 |
| 1996 | 984,506 | 2.14% | 44163 |
| 1997 | 1,006,760 | 2.21% | 44163 |
| 1998 | 1,028,694 | 2.13% | 44163 |
| 1999 | 1,048,151 | 1.86% | 44163 |
| 2000 | 1,063,715 | 1.46% | 44163 |
| 2001 | 1,074,761 | 1.03% | 44163 |
| 2002 | 1,082,183 | 0.69% | 44163 |
| 2003 | 1,087,929 | 0.53% | 44163 |
| 2004 | 1,094,758 | 0.62% | 44163 |
| 2005 | 1,104,642 | 0.89% | 44163 |
| 2006 | 1,118,253 | 1.22% | 44163 |
| 2007 | 1,134,977 | 1.47% | 44163 |
| 2008 | 1,153,929 | 1.64% | 44163 |
| 2009 | 1,173,678 | 1.68% | 44163 |
| 2010 | 1,193,148 | 1.63% | 44163 |
| 2011 | 1,212,159 | 1.57% | 44163 |
| 2012 | 1,230,985 | 1.53% | 44163 |
| 2013 | 1,249,514 | 1.48% | 44163 |
| 2014 | 1,095,021 | -14.11% | (Worldbank) |
| 2015 | 1,104,044 | 0.82% | (Worldbank) |
| 2016 | 1,113,984 | 0.89% | (Worldbank) |
| 2017 | 1,124,753 | 0.96% | 44163 |
| 2018 | 1,136,191 | 1.01% | (Worldbank) |
| 2019 | 1,148,130 | 1.04% | (Worldbank) |
| 2026 | 1,235,549 | 7.08% |
Map & Images (more maps)

Swaziland Flag Map
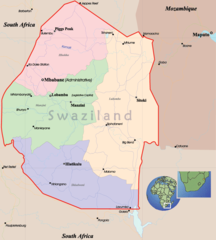
Swaziland Political Map