Romania (România), RO
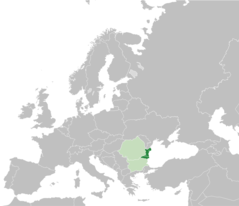
Romania: Located at the crossroads of Central, Eastern, and Southeastern Europe, this country is the twelfth-largest in Europe by area.
About

Country Snapshot
România at a glance
România currently has 1,540 quality-checked populated place pages and 42 state or regional pages linked on MapSof.
Mapped cities & towns
1,540
These counts use a stricter populated-place filter so the main lists stay focused on real city and town pages.
States & regions
42
Open related pagesLargest city
BucharestPopulation 1,929,000
Top linked places
Quick Facts about România
| Population | 19,036,031 |
| Country | Romania |
| Plate code | RO |
| Area | 238397 km2 |
| Official name | România, la Roumanie |
| Continent | Europe |
| Easternmost point | Point(29.71667916 45.16381636) |
| Northernmost point | Point(26.7 48.27) |
| Latitude & Longitude | 46.0000,25.0000 |
| Legislative body | Parliament of Romania |
| Named for | Ancient Rome |
| Official language | Romanian |
| Capital | Bucharest |
| Establishment | February 05, 1859 (167 years ago) |
| Time Zone | Europe/Bucharest, Eastern European Summer Time, UTC+02:00, UTC+03:00, Eastern European Time |
| Local time | 07:38:09 (10th June 2026) |

Geography
România is located at 46°0'0"N 25°0'0"E (46.0000000, 25.0000000). It has 7 neighbors: Moldova, Ukraine, Bulgaria, Poland, Hun, Union and Serbia.
Romania map
The largest city of România is Bucharest with a population of 1,929,000. Other cities include, Iaşi population 320,888, Cluj-Napoca population 317,953, Timişoara population 317,953 and Craiova population 304,142. See all România cities & populated places.
Official website of România
Official WebsiteCompare România with
- Prahova County
- Cluj County
- Argeș County
- Mureș County
- Tulcea County
- Sălaj County
- Brașov County
- Covasna County
- Suceava County
- Vaslui County
- Călărași County
- Giurgiu County
- Ialomița County
- Sibiu County
- Bucharest
- Dâmbovița County
- Mehedinți County
- Arad County
- Bihor County
- Satu Mare County
- Gorj County
- Harghita County
- Buzău County
- Alba County
- Neamț County
- Bistrița-Năsăud County
- Maramureș County
- Timiș County
- Ilfov County
- Vrancea County
- Iași County
- Bacău County
- Caraș-Severin County
- Botoșani County
- Vâlcea County
- Hunedoara County
- Olt County
- Teleorman County
- Dolj County
- Brăila County
- Galați County
- Constanța County
Demographics
| Year | Population | % Change | Method |
|---|---|---|---|
| 1960 | 18,406,905 | - | census |
| 1961 | 18,555,250 | 0.8% | census |
| 1962 | 18,676,550 | 0.65% | census |
| 1963 | 18,797,850 | 0.65% | census |
| 1964 | 18,919,126 | 0.64% | census |
| 1965 | 19,031,576 | 0.59% | census |
| 1966 | 19,215,450 | 0.96% | census |
| 1967 | 19,534,242 | 1.63% | census |
| 1968 | 19,799,831 | 1.34% | census |
| 1969 | 20,009,141 | 1.05% | census |
| 1970 | 20,250,398 | 1.19% | census |
| 1971 | 20,461,567 | 1.03% | census |
| 1972 | 20,657,957 | 0.95% | census |
| 1973 | 20,835,681 | 0.85% | census |
| 1974 | 21,029,429 | 0.92% | census |
| 1975 | 21,293,583 | 1.24% | census |
| 1976 | 21,551,634 | 1.2% | census |
| 1977 | 21,756,096 | 0.94% | census |
| 1978 | 21,951,464 | 0.89% | census |
| 1979 | 22,090,488 | 0.63% | census |
| 1980 | 22,242,653 | 0.68% | census |
| 1981 | 22,415,169 | 0.77% | census |
| 1982 | 22,515,389 | 0.45% | census |
| 1983 | 22,588,790 | 0.32% | census |
| 1984 | 22,655,940 | 0.3% | census |
| 1985 | 22,755,427 | 0.44% | census |
| 1986 | 22,859,269 | 0.45% | census |
| 1987 | 22,949,430 | 0.39% | census |
| 1988 | 23,057,662 | 0.47% | census |
| 1989 | 23,161,458 | 0.45% | census |
| 1990 | 23,201,835 | 0.17% | census |
| 1991 | 23,001,155 | -0.87% | census |
| 1992 | 22,794,284 | -0.91% | census |
| 1993 | 22,763,280 | -0.14% | census |
| 1994 | 22,730,211 | -0.15% | census |
| 1995 | 22,684,270 | -0.2% | census |
| 1996 | 22,619,004 | -0.29% | census |
| 1997 | 22,553,978 | -0.29% | census |
| 1998 | 22,507,344 | -0.21% | census |
| 1999 | 22,472,040 | -0.16% | census |
| 2000 | 22,442,971 | -0.13% | census |
| 2001 | 22,131,970 | -1.41% | census |
| 2002 | 21,730,496 | -1.85% | census |
| 2003 | 21,574,326 | -0.72% | census |
| 2004 | 21,451,748 | -0.57% | census |
| 2005 | 21,319,685 | -0.62% | census |
| 2006 | 21,193,760 | -0.59% | census |
| 2007 | 20,882,982 | -1.49% | census |
| 2008 | 20,537,875 | -1.68% | census |
| 2009 | 20,367,487 | -0.84% | census |
| 2010 | 20,246,871 | -0.6% | census |
| 2011 | 20,147,528 | -0.49% | census |
| 2012 | 20,058,035 | -0.45% | census |
| 2013 | 19,981,358 | -0.38% | census |
| 2014 | 19,910,995 | -0.35% | census |
| 2015 | 19,815,616 | -0.48% | (Worldbank) |
| 2016 | 22,241,718 | 10.91% | census |
| 2017 | 19,586,539 | -13.56% | census |
| 2018 | 19,472,545 | -0.59% | (Worldbank) |
| 2019 | 19,356,544 | -0.6% | (Worldbank) |
| 2026 | 19,036,031 | -1.68% |
Map & Images (more maps)
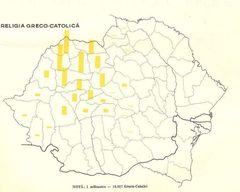
1930 Greco Catolica
Agglomeratie Galati Braila
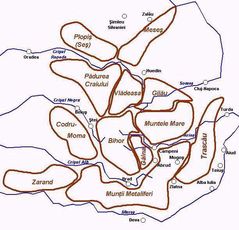
Apuseni Skizze Gliederung
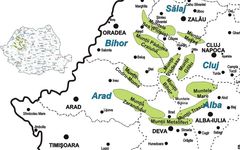
Apuseni In Romania
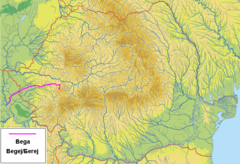
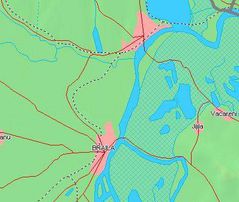
Bega
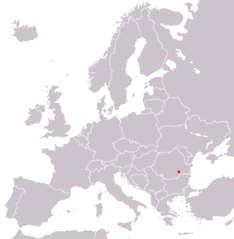
Bucarest In Europe Map 1
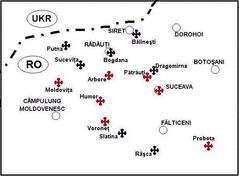
Bukovina Monasteries
Cob Data Romania
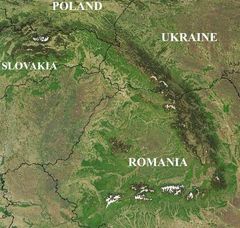
Carpathians Satellite
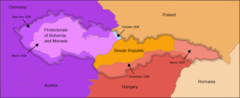
Czechoslovakia 1939he 1
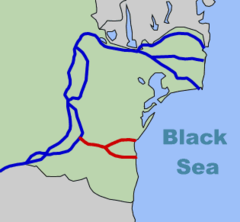
Danube Black Sea Canal
Dobruja In Europe Map
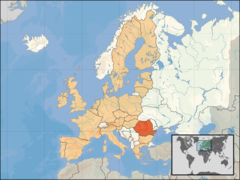
Eu Location Rom
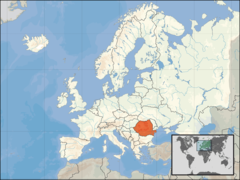
Europe Location Rom
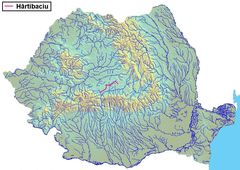
Hartibaciu
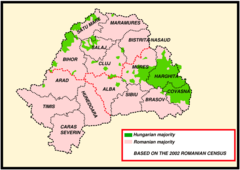
Hungarians Romania2
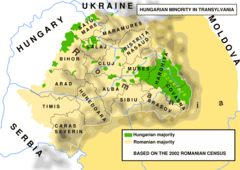
Hungarians In Romania
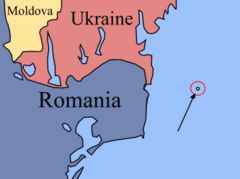
Insula Serpilor Map
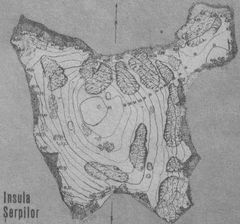
Insula Serpilor
Limba Romana Atlanticul