Chad (Republic of Chad), TD
Chad: Located in north-central Africa, this landlocked nation is characterized by its diverse landscapes, from the Sahara Desert in the north to the fertile Sahelian belt in the south.
About

Country Snapshot
Republic of Chad at a glance
Republic of Chad currently has 30 quality-checked populated place pages and 15 state or regional pages linked on MapSof.
Mapped cities & towns
30
These counts use a stricter populated-place filter so the main lists stay focused on real city and town pages.
States & regions
15
Open related pagesLargest city
N'DjamenaPopulation 1,092,066
Top linked places
Quick Facts about Republic of Chad
| Population | 19,340,757 |
| Country | Chad |
| Plate code | TD, TCH |
| Area | 1284000 km2 |
| Official name | la République du Tchad, Tchad |
| Continent | Africa |
| Easternmost point | Point(23.99999604 15.6988081) |
| Northernmost point | Point(15.99996802 23.44922574) |
| Latitude & Longitude | 15.0000,19.0000 |
| Legislative body | National Assembly |
| Named for | Lake Chad |
| Official language | Arabic, French |
| Capital | N'Djamena |
| Establishment | August 11, 1960 (65 years ago) |
| Time Zone | UTC+01:00 |
| Local time | 21:23:47 (11th July 2026) |

Geography
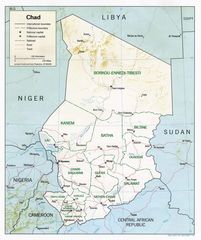
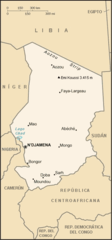
Republic of Chad is located at 15°0'0"N 19°0'0"E (15.0000000, 19.0000000). It has 5 neighbors: Central African Republic, Sudan, Cameroon, Nigeria and Niger.
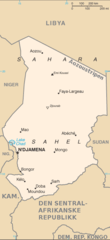
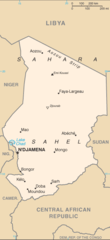
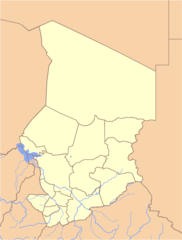
Chad map
The largest city of Republic of Chad is N'Djamena with a population of 1,092,066. Other cities include, Moundou population 135,167, Sarh population 102,528, Kelo population 42,533 and Am-Timan population 38,261. See all Republic of Chad cities & populated places.
Compare Republic of Chad with
- Mayo-Kebbi Ouest Region
- N'Djamena
- Lac Region
- Ouaddaï Region
- Logone Occidental Region
- Wadi Fira Region
- Moyen-Chari Region
- Tibesti Region
- Salamat Region
- Kanem Region
- Guéra Region
- Ennedi Region
- Sila Region
- Borkou
- Mandoul Region
- Logone Oriental Region
- Chari-Baguirmi Region
- Tandjilé Region
- Bahr el Gazel
- Mayo-Kebbi Est Region
- Batha Region
- Hadjer-Lamis
Demographics
| Year | Population | % Change | Method |
|---|---|---|---|
| 1960 | 3,002,596 | - | census |
| 1961 | 3,061,423 | 1.92% | census |
| 1962 | 3,122,357 | 1.95% | census |
| 1963 | 3,184,775 | 1.96% | census |
| 1964 | 3,247,798 | 1.94% | census |
| 1965 | 3,310,921 | 1.91% | census |
| 1966 | 3,373,563 | 1.86% | census |
| 1967 | 3,436,227 | 1.82% | census |
| 1968 | 3,500,777 | 1.84% | census |
| 1969 | 3,569,777 | 1.93% | census |
| 1970 | 3,644,911 | 2.06% | census |
| 1971 | 3,727,381 | 2.21% | census |
| 1972 | 3,816,295 | 2.33% | census |
| 1973 | 3,908,721 | 2.36% | census |
| 1974 | 4,000,505 | 2.29% | census |
| 1975 | 4,088,858 | 2.16% | census |
| 1976 | 4,173,072 | 2.02% | census |
| 1977 | 4,254,762 | 1.92% | census |
| 1978 | 4,336,366 | 1.88% | census |
| 1979 | 4,421,416 | 1.92% | census |
| 1980 | 4,512,758 | 2.02% | census |
| 1981 | 4,610,917 | 2.13% | census |
| 1982 | 4,715,985 | 2.23% | census |
| 1983 | 4,829,852 | 2.36% | census |
| 1984 | 4,954,649 | 2.52% | census |
| 1985 | 5,091,809 | 2.69% | census |
| 1986 | 5,242,737 | 2.88% | census |
| 1987 | 5,407,077 | 3.04% | census |
| 1988 | 5,582,282 | 3.14% | census |
| 1989 | 5,764,631 | 3.16% | census |
| 1990 | 5,951,574 | 3.14% | census |
| 1991 | 6,142,558 | 3.11% | census |
| 1992 | 6,338,934 | 3.1% | census |
| 1993 | 6,542,419 | 3.11% | census |
| 1994 | 6,755,540 | 3.15% | census |
| 1995 | 6,980,351 | 3.22% | census |
| 1996 | 7,216,321 | 3.27% | census |
| 1997 | 7,463,347 | 3.31% | census |
| 1998 | 7,724,316 | 3.38% | census |
| 1999 | 8,002,899 | 3.48% | census |
| 2000 | 8,301,151 | 3.59% | census |
| 2001 | 8,620,917 | 3.71% | census |
| 2002 | 8,959,964 | 3.78% | census |
| 2003 | 9,311,234 | 3.77% | census |
| 2004 | 9,665,024 | 3.66% | census |
| 2005 | 10,014,413 | 3.49% | census |
| 2006 | 10,356,822 | 3.31% | census |
| 2007 | 10,694,366 | 3.16% | census |
| 2008 | 11,030,628 | 3.05% | census |
| 2009 | 11,039,873 | 0.08% | census |
| 2010 | 11,720,781 | 5.81% | census |
| 2011 | 12,080,037 | 2.97% | census |
| 2012 | 12,448,175 | 2.96% | census |
| 2013 | 12,825,314 | 2.94% | census |
| 2014 | 13,663,559 | 6.13% | (Worldbank) |
| 2015 | 14,110,975 | 3.17% | (Worldbank) |
| 2016 | 14,561,666 | 3.1% | (Worldbank) |
| 2017 | 15,016,773 | 3.03% | (Worldbank) |
| 2018 | 15,477,751 | 2.98% | census |
| 2019 | 15,946,876 | 2.94% | (Worldbank) |
| 2026 | 19,340,757 | 17.55% |
Map & Images (more maps)

At0705 Map 2

At0904 Map 1
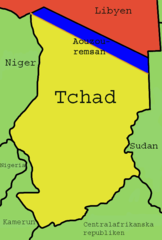
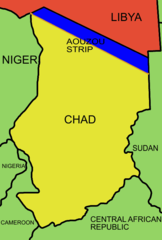
Aouzouremsan Mellan Libyen Och Tchad Sv
Cd Map No
Cd Map
Chad Locator
Chad Map
Chad Prefectures Numbered 300px
Chad Departments
Chad Mapa
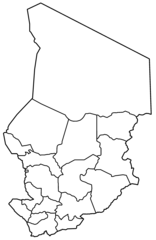
Chad Regions Blank
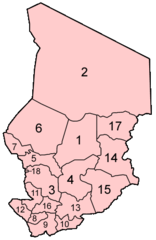
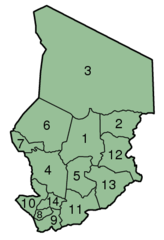
Chad Regions Numbered
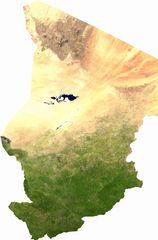
Chad Sat
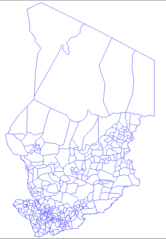
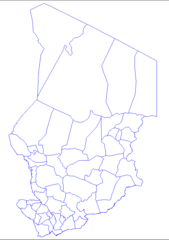
Chad Sub Prefectures
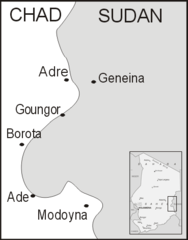
Chad Sudan Border
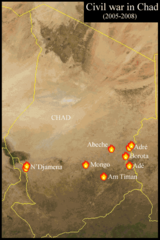
Civil War In Chad
Darfur Refugee Camps Map
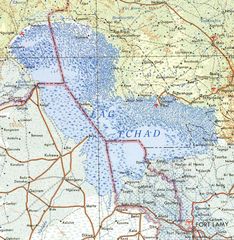
Lake Chad 1973
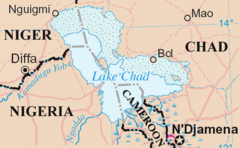
Lakechad Map 1
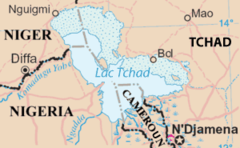
Lakechad Mapfr 1